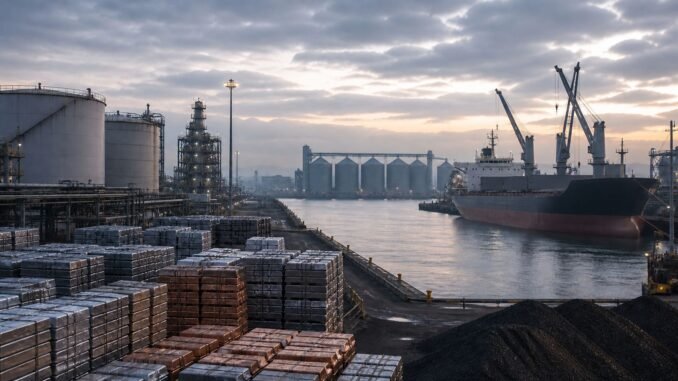
Global commodity prices sent an apparently reassuring signal in June. The World Bank’s energy price index dropped 17.7% from May, while its non-energy index fell 3.2%. Brent crude declined 20.6%, fertiliser prices plunged 21.8%, and precious metals lost 9.2%.
Those numbers suggest that the intense price shock earlier in 2026 was unwinding. But the latest evidence does not support a simple return-to-normal story.
The U.S. Energy Information Administration’s August outlook says severe constraints on transit through the Strait of Hormuz are likely to persist through August. It expects the disruption to draw global oil inventories lower and keep Brent crude near early-August levels, forecasting an average of about US$85 a barrel in the third quarter.
The tension is important: a commodity index can fall rapidly even while the physical system remains vulnerable. Prices respond not only to how much oil, metal or grain exists, but also to where it is, whether it can move, and how much spare inventory is available when another disruption arrives.
Information and forecasts in this article are current as of 17 August 2026.
Why the June Decline Was So Broad
The World Bank’s June data show that the retreat extended beyond oil. Agricultural prices fell 1.7%, led by a 2.6% decline in food prices. Metals fell 2.4%, with nickel down 6.5% and aluminium down 6.2%. Silver and platinum led a 9.2% fall in precious metals.
Part of that move reflects the reversal of an earlier risk premium. When traders fear that supply routes or production facilities may be impaired, prices can rise before the full shortage reaches end users. When the perceived probability or duration of disruption falls, that premium can disappear just as quickly.
Demand adjustment also matters. High prices encourage households and businesses to conserve fuel, delay purchases or switch inputs. Refiners may reduce runs when crude is scarce, while manufacturers can draw down inventories or postpone orders. These responses reduce immediate demand and help prices retreat.
But a falling monthly index is a measure of price movement, not a complete audit of supply resilience.
Oil Shows the Difference Between Price and Security
The oil market makes that distinction unusually clear.
In July, the International Energy Agency reported that global oil supply had rebounded by 4.1 million barrels a day in June as Gulf flows partially recovered. Benchmark crude prices erased their wartime gains during the month as tanker traffic improved and the market began to focus on the possibility of future oversupply.
Yet the same report said global output remained about 9.4 million barrels a day below pre-war levels. OECD inventories fell by another 62 million barrels in June, including an estimated 44 million barrels drawn from government stock releases. Product markets remained tight because some export refineries had not restarted and refinery runs were still well below the previous year.
That combination explains why crude prices can decline while diesel, jet fuel or other refined-product costs remain firmer. More crude reaching the market does not immediately restore damaged or idled refining capacity. Nor does oil on a tanker provide the same buffer as product already stored near consumers.
The EIA’s August forecast reinforces the point. It expects U.S. commercial crude inventories to remain below the low end of their 2021–2025 range through the end of 2026. It also raised its 2026 wholesale diesel-price forecast by 8.5% from July and its gasoline forecast by 5.9%.
These are forecasts, not certainties. They depend on assumptions about shipping access, production recovery, demand and inventory rebuilding. But they show why a lower spot price is not proof that the system has regained its margin of safety.
The Inflation Signal Is Mixed
Lower commodity prices usually help inflation with a lag. Cheaper crude can reduce transport and manufacturing costs. Lower food and fertiliser prices can ease pressure on household budgets and agricultural producers. Falling metals prices can reduce input costs for construction, machinery and durable goods.
The transmission is neither immediate nor uniform.
Businesses may have bought inventory at earlier, higher prices. Shipping, insurance, refining and financing costs can remain elevated even after the underlying commodity falls. Currency movements can also offset a global price decline for importers whose domestic currency weakens against the U.S. dollar.
For central banks, the relevant question is therefore not whether a broad index fell in one month. It is whether lower input costs persist long enough to reduce consumer-price pressure without another supply interruption reversing the move.
Who Is Most Exposed
Energy-intensive manufacturers and transport companies face the most direct margin risk. A business can benefit from lower crude prices yet still pay more for diesel, electricity, insurance or freight if the bottleneck sits further along the supply chain.
Commodity producers face the opposite tension. Lower prices can squeeze cash flow and discourage new investment, particularly for high-cost mines or fields. That restraint may support prices later if demand recovers faster than supply capacity.
For investors, the lesson is not that commodities must rise or fall. It is that different parts of the complex can move in opposite directions. Oil, natural gas, fertiliser, industrial metals and precious metals respond to different supply constraints, demand drivers and inventory conditions. Treating “commodities” as one trade can obscure the underlying economics.
Households may see relief unevenly. Fuel prices can decline before food, airfares or utility bills adjust, while taxes, regulated tariffs and retailer pricing decisions influence how much of a wholesale move reaches consumers.
What to Watch
Several indicators will show whether the June decline becomes a durable easing cycle or another pause in a volatile year:
- Strait of Hormuz transit volumes: sustained normalisation would reduce the probability of further inventory draws.
- Commercial and strategic inventories: rebuilding would give the market more protection against the next disruption.
- Refinery utilisation and product stocks: these determine whether lower crude prices reach diesel, jet fuel and gasoline users.
- Freight and insurance costs: persistent logistics premiums can keep delivered prices high even when benchmarks fall.
- China and global industrial demand: stronger manufacturing activity would support metals and energy consumption; weaker activity would do the reverse.
- Fertiliser and food prices: these reveal whether energy disruption is spreading into agricultural production costs.
Finance World’s Read
June’s broad commodity decline is economically helpful, but it is not an all-clear signal.
The market has moved from an acute price shock towards a more complicated phase in which improving flows coexist with low inventories, constrained shipping and uneven refining capacity. That makes headline indexes less informative than the condition of the physical system beneath them.
Readers should resist two extremes: assuming every disruption must produce permanently higher prices, or assuming one sharp monthly decline means the supply risk has disappeared. The more defensible conclusion is that inflation pressure may ease, but the commodity system remains unusually sensitive to transport, inventory and geopolitical shocks.
Sources
- World Bank: Commodity prices declined in June—Pink Sheet
- World Bank: Commodity Markets Outlook, April 2026
- International Energy Agency: Oil Market Report, July 2026
- U.S. Energy Information Administration: Short-Term Energy Outlook, August 2026
This article is for general informational purposes only and does not constitute financial, investment, tax or legal advice.